
I recently stumbled upon Gartner’s Hype Cycle Builder, which simply put allows you to build custom Gartner’s hype cycle graphs for a given technology innovation or architecture. Unfortunately, it’s only available for paying clients ![]()
Poor Man’s Gartner’s Hype Cycle Builder !
So I set out to build a poor man’s version of it and see if all technology trends follow this hype cycle.
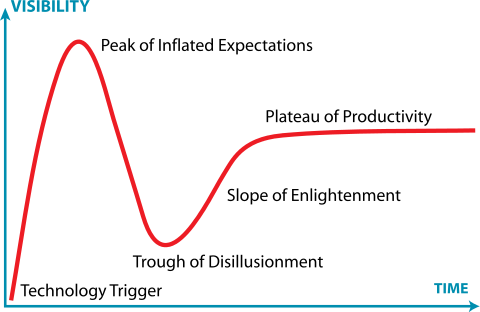
Before moving, here’s what Wikipedia has to say about Gartner Hype Cycle (it’s fairly straight forward) :
The Gartner hype cycle is a graphical presentation developed, used and branded by the American research, advisory and information technology firm Gartner to represent the maturity, adoption, and social application of specific technologies.
Trend Data
Here again we’ll have to improvise !
As we don’t have access to Gartner’s trend database, we will rely on Google Trends to find the trend curve for a given keyword. Google Trends defines interest over time as the following :
Numbers represent search interest relative to the highest point on the chart for the given region and time. A value of 100 is the peak popularity for the term. A value of 50 means that the term is half as popular. A score of 0 means there was not enough data for this term.
Hype Cycle over Google Trends
Now to the fun part !
First we’ll get the Google Trends graph for a given keyword, then we’ll plot a hype cycle over it as best as we can. We’ll try to generate the hype cycle by smoothing out the Google Trends graph and then try to interpret the smoothed graph as the hype cycle.
This method is by no means an accurate measure of hype, but it’s accurate enough for our case. In addition to this I’m going to use the following assumptions :
- Sharp increase in graph’s slope => more search/interest => Technology Trigger
- Sharp decrease in graph’s slope following a sharp increase => interest quickly dwindling => Peak of Inflated Expectations and Trough of Disillusionment
- Smooth increase after local bottom => renewed serious interest => Slope of Enlightenment
- Stable and slightly decreasing slope => stable interest and more serious usage => Plateau of Productivity
Hype Cycles
Each of the following illustrations is an attempt to draw a hype curve over Google Trends data for a given technology. The hype curve (red curve) is just the moving average of the Google Trends curve.
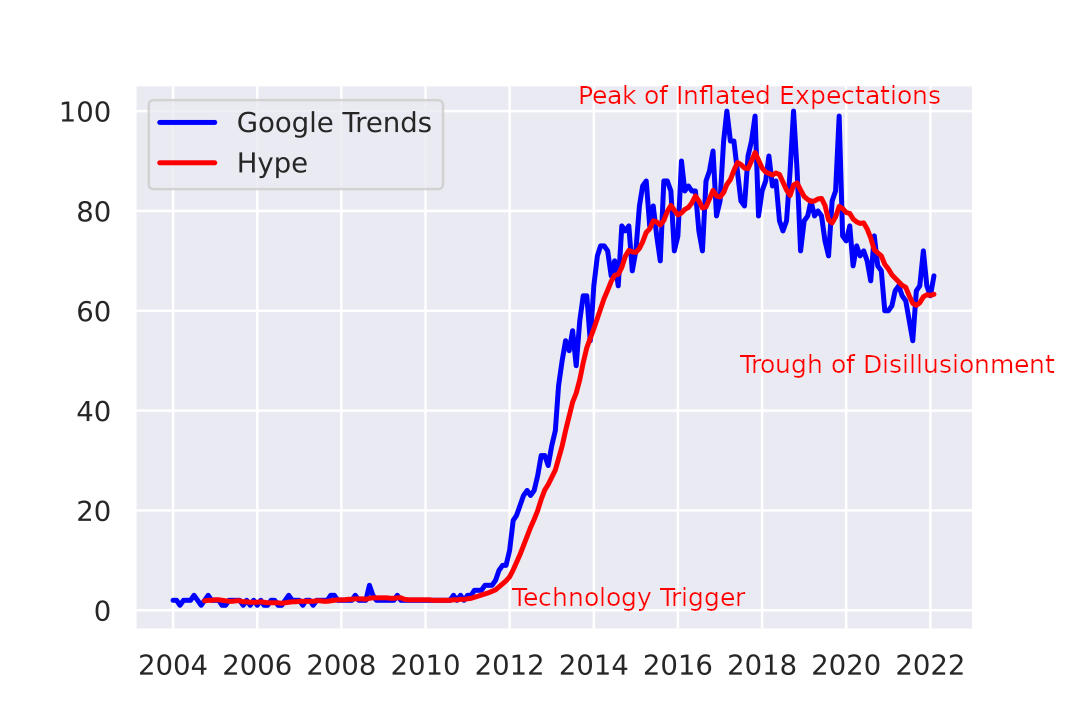
Microservices hype cycle / 2004-2022
Microservices getting to maturity
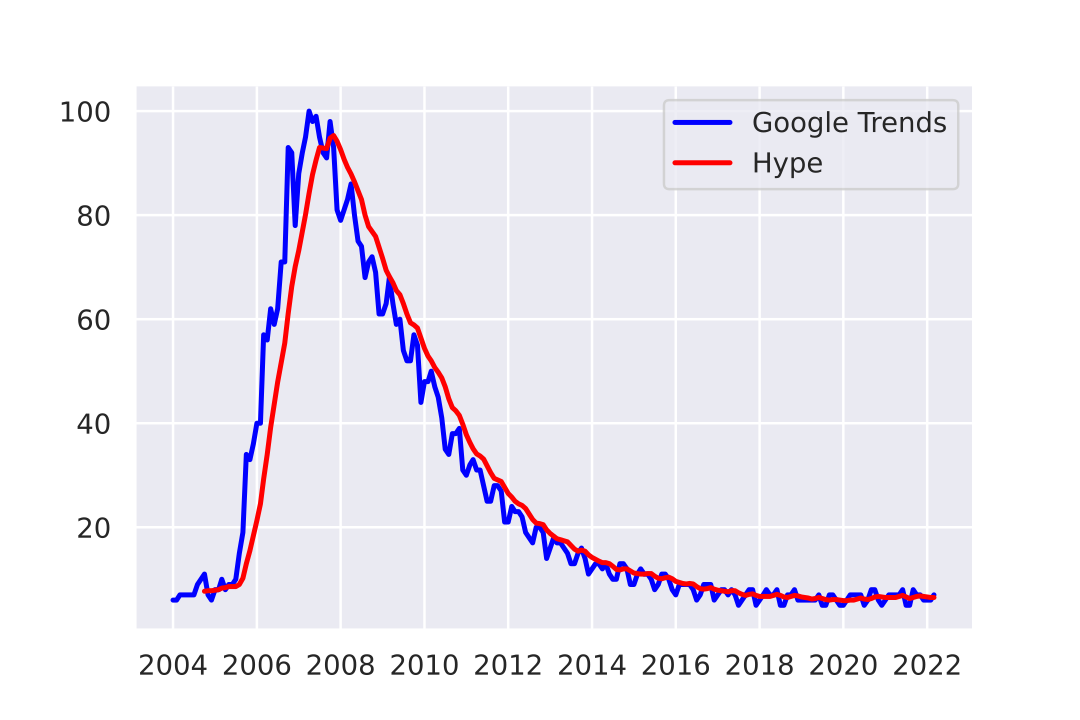
Docker hype cycle / 2004-2022
The dip in 2021 is probably related to Docker moving to paid/limited model
Hadoop hype cycle / 2004-2022
Hadoop’s deep dive is not over yet !
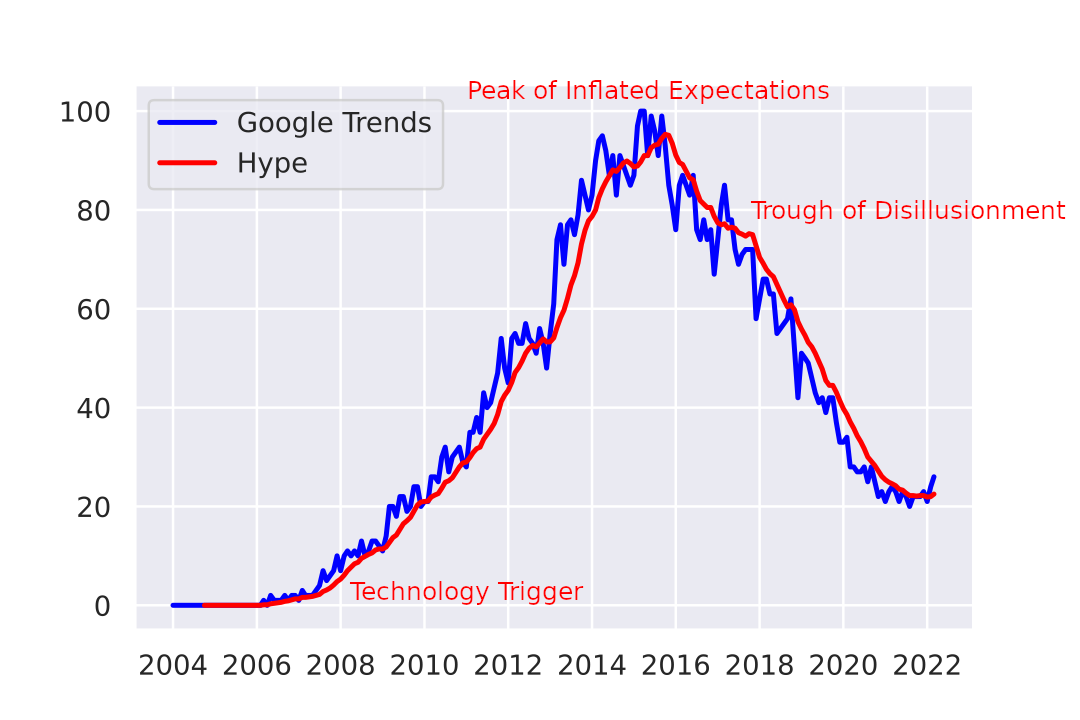
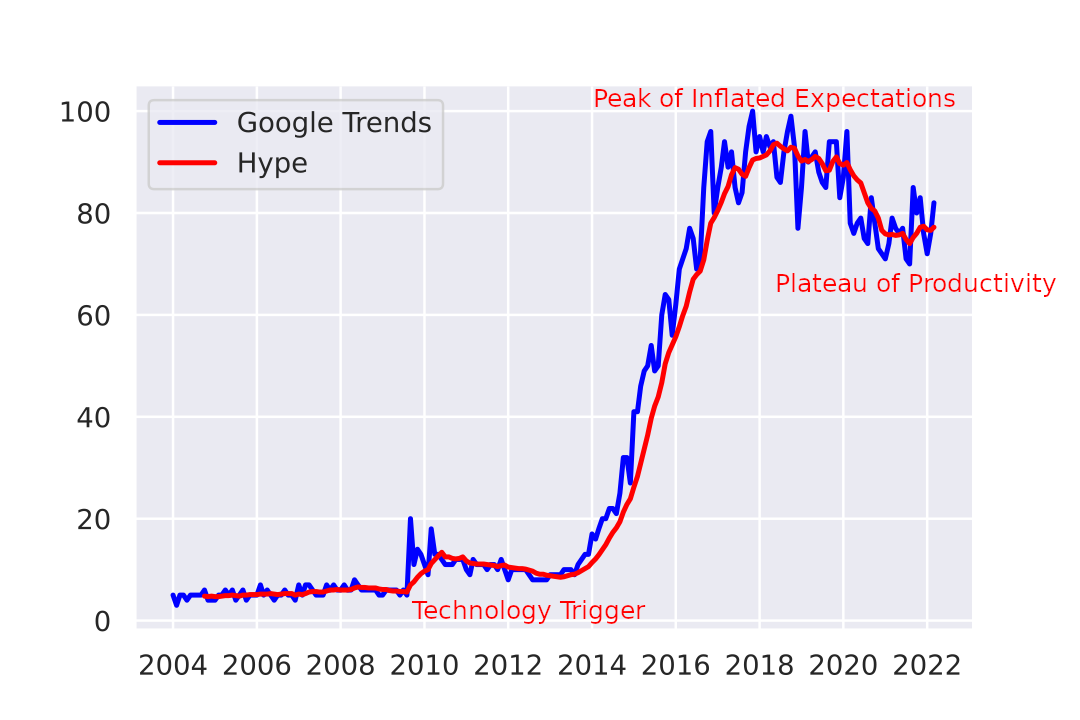
Big Data hype cycle / 2004-2022
There’s still some momentum behind Big Data
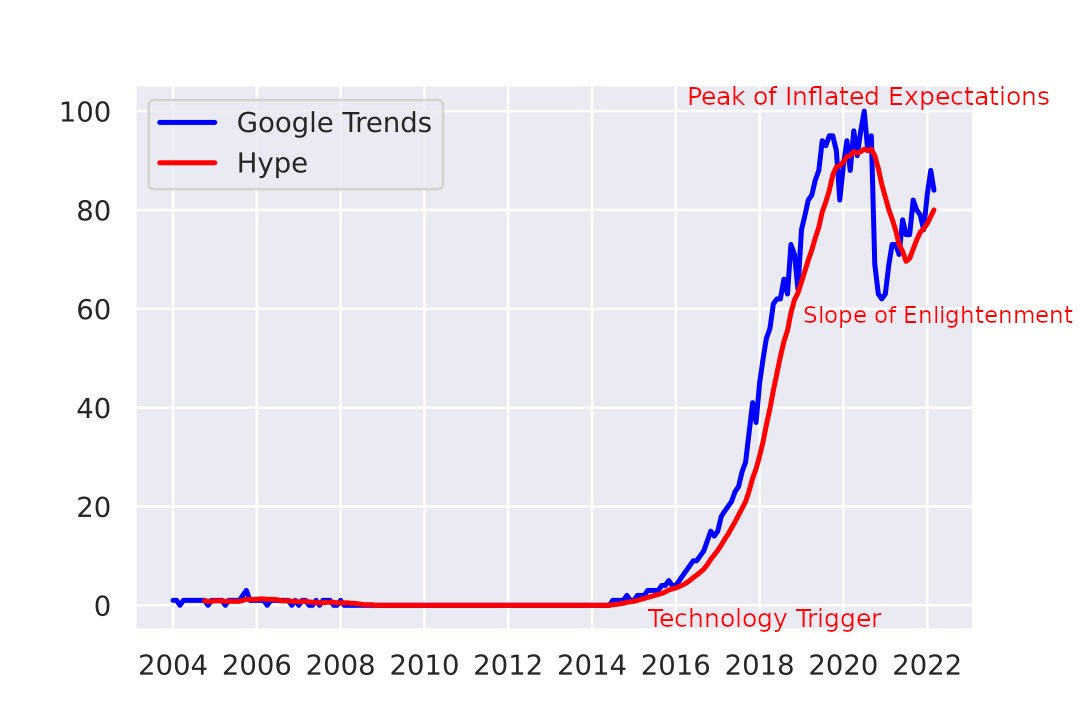
Kubernetes hype cycle / 2004-2022
Very tight gap between the peak and the first local bottom, we’ll see how the trend moves as Kubernetes matures … or not
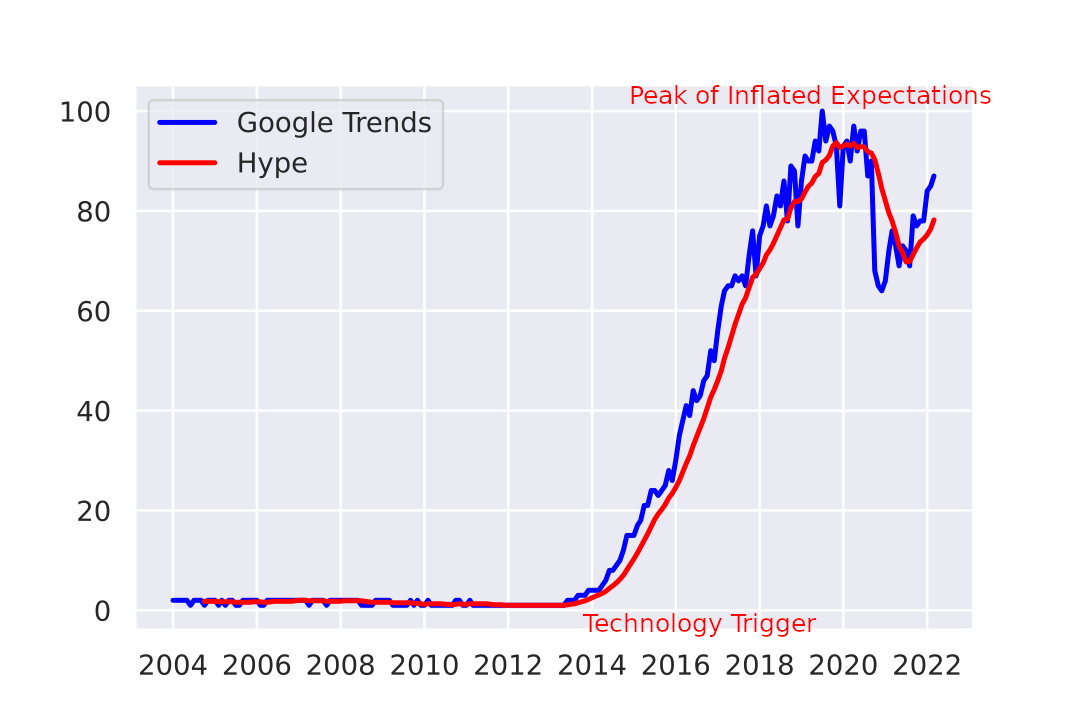
Internet of Things (IoT) hype cycle / 2004-2022
IoT is on its way for a stable and productive trend
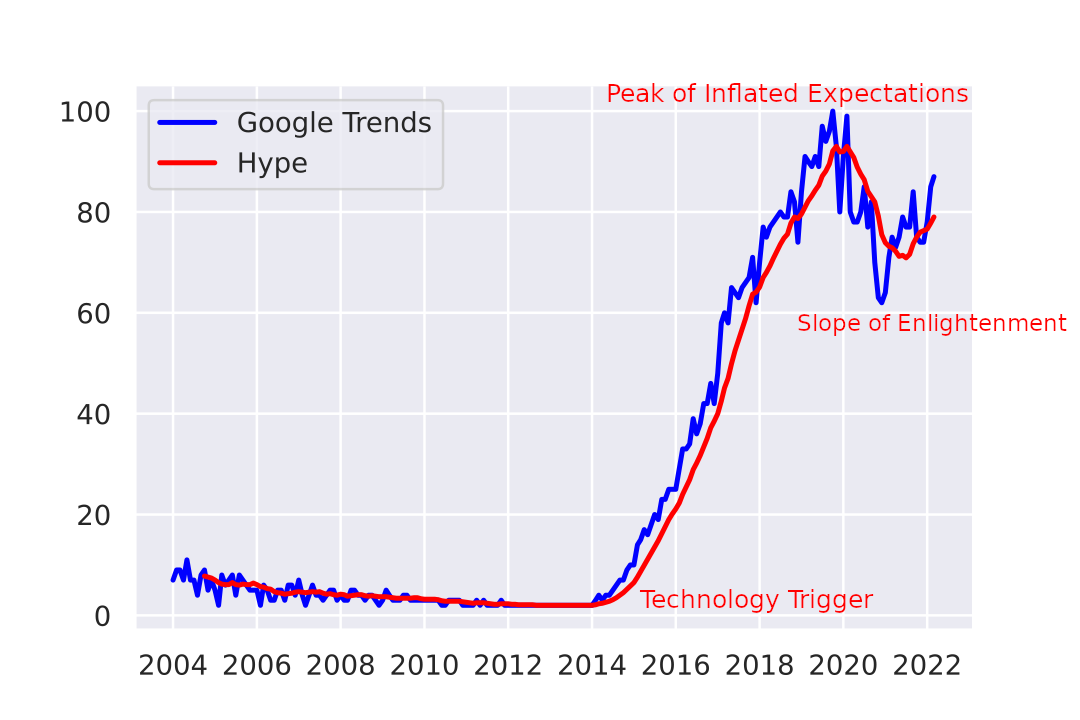
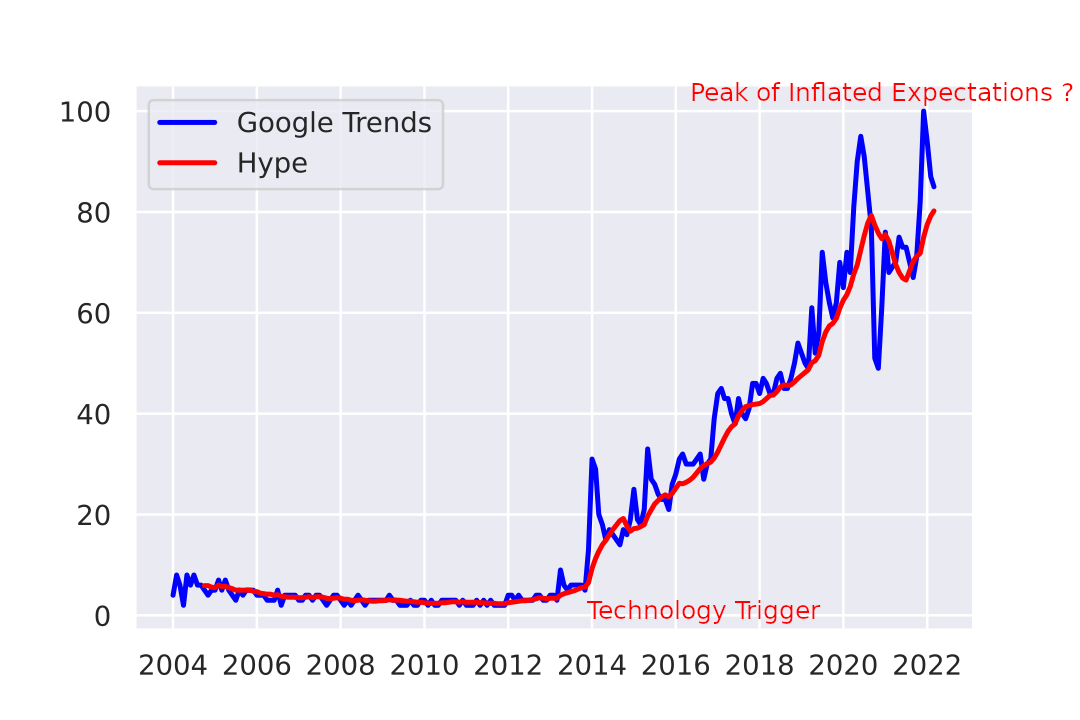
Artificial Intelligence (AI) hype cycle / 2004-2022
hummm… ![]()
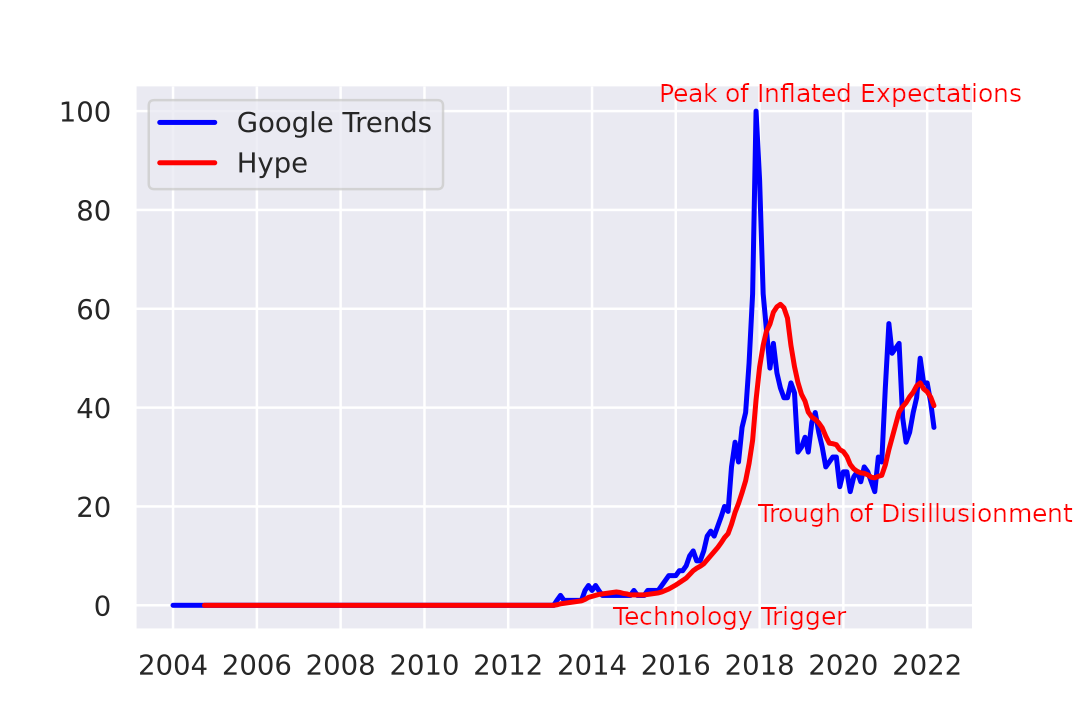
Blockchain hype cycle / 2004-2022
It really just follows Bitcoin price curve!!
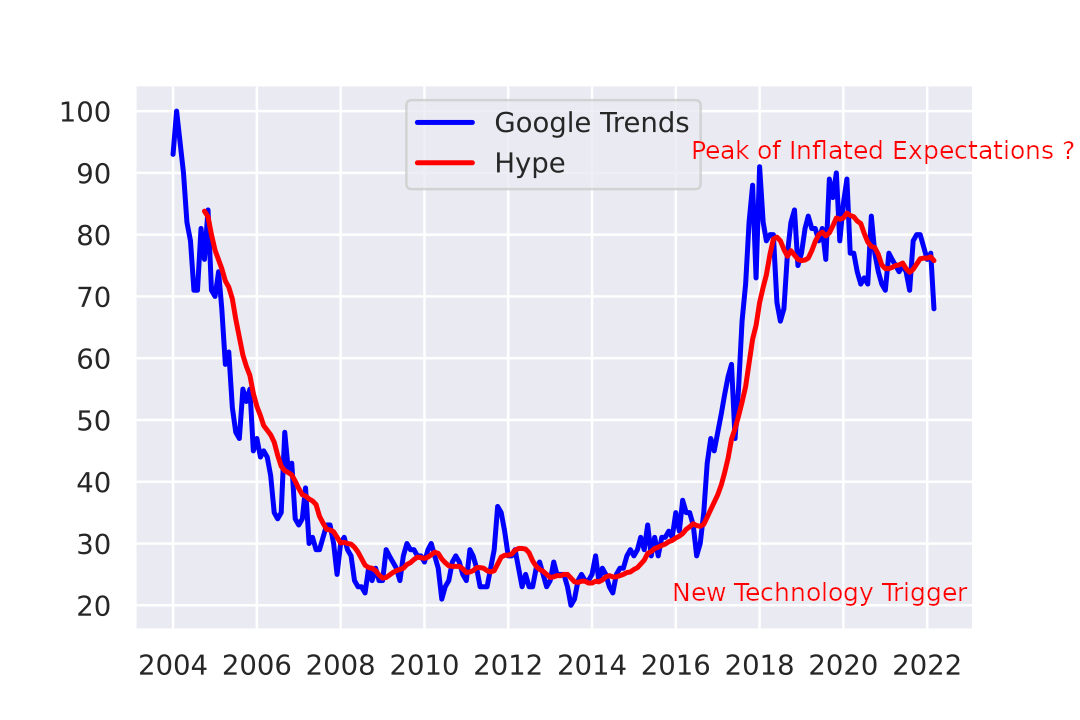
Web X.0 hype cycle / 2004-2022
To understand Web 3.0 we should look at Web 2.0 trend and the confusion around Web 3.0 that it created when it first came out …
Web 3.0 hype cycle / 2004-2022
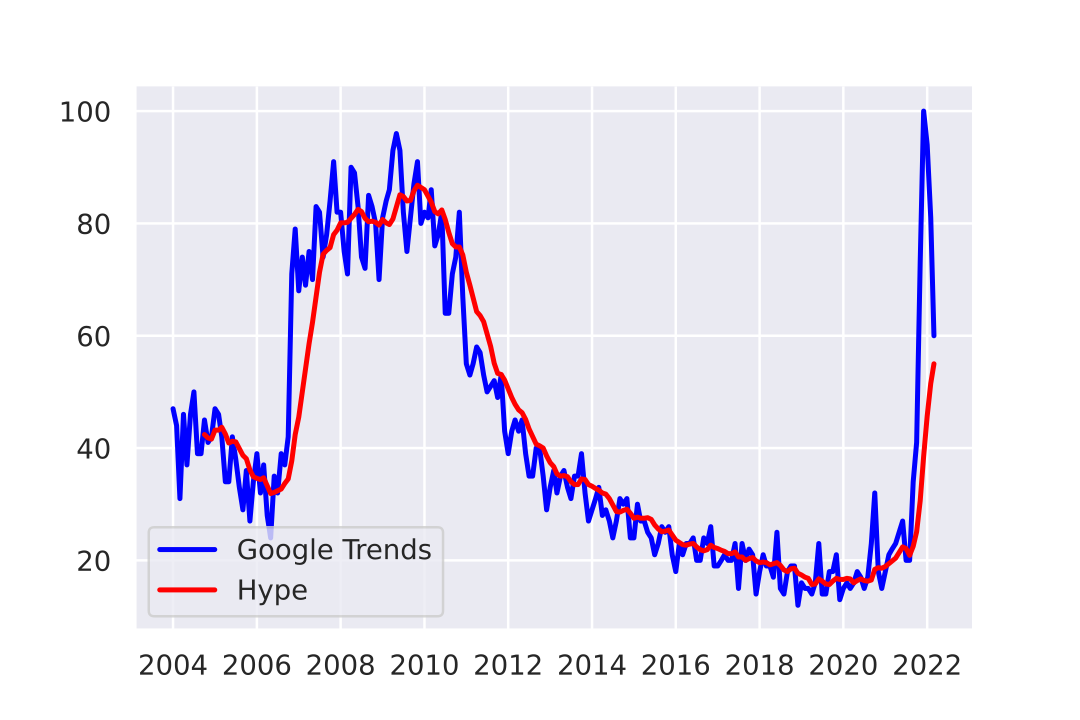
Web 2.0 hype cycle / 2004-2022
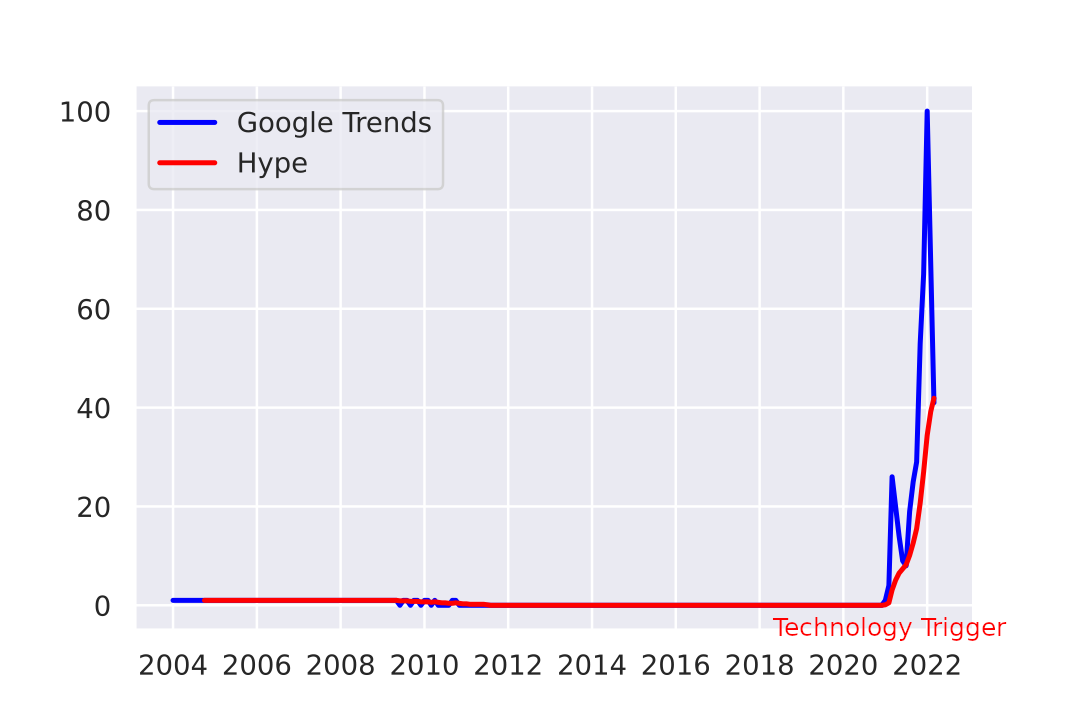
NFT hype cycle / 2004-2022
![]()
![]()
Rust Programming Language hype cycle / 2004-2022
Some jitter in last couple of years but it’s still on an upward trend
Wanna generate your own Hype Cycles ?!
Head over to https://github.com/marouni/google_trends_hype_generator and clone the Python Notebook.